PocketQuery Help
PocketQuery is a web interface for exploring the the properties of protein-protein interaction (PPI) interfaces with a focus on the discovery of promising starting points for small-molecule design. PocketQuery is regularly updated with PPI structures from the PDB. All protein-containing complexes are analyzed using the first biological assembly. If a biological assembly is not available, the first model of the asymmetric unit is used. Additionally, users may upload their own PPI structures.
Clusters
Because of the focus on identifying small-molecule starting points, the primary unit of analysis in PocketQuery is a cluster of interface residues. An interface residue is defined as a residue where the change in SASA upon complexation is more than 0.05Å2. Only clusters where the maximum distance between the center of mass of any two residues is less than 12Å are analyzed. Only standard residues are analyzed (modified residues are removed from the structure).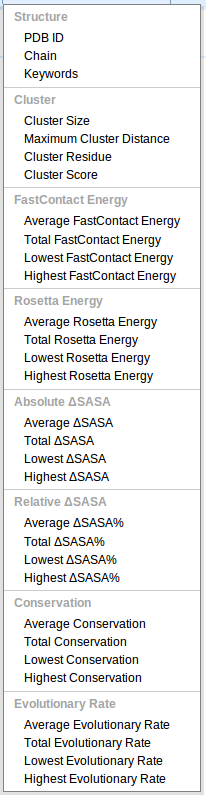
Properties
Each cluster of residues is annotated with a large collection of pre-computed properties. Per-residue properties, such as the change in solvent accessible surface area (SASA), are aggregated into lowest, highest, average, and total values for the cluster.- PDB ID The four character Protein Data Bank acension code for the complex.
- Chain The single character, case-sensitive chain identifier.
- Keywords Full text search of the keywords and title of the PDB.
- Cluster Size The number of residues in a cluster.
- Maximum Cluster Distance The longest distance in Angstroms between the centroids of any two residues in the cluster.
- Cluster Residue The types of amino acids that make up the cluster.
- Cluster Score A consensus score of the suitability of the cluster to serve as a starting point for the design of a small-molecule inhibitor of the PPI. See our article in Bioinformatics for more details.
- FastContact Energy (ΔG) The FastContact 2.0 estimate of the per-residue free energy of complexation (kcal/mol). Includes both electrostatic and desolvation effects. A more negative value indicates that a residue undergoes a more favorable change in energy upon complexation.
- Rosetta Energy (ΔΔG) An estimate of the per-residue change in free energy of complexation between this complex and an alanine mutant. Computed using Rosetta version 3.2.1. A larger, more positive, value indicates that a residue is more likely to have a stabilizing influence on the complex.
- Absolute ΔSASA The per-residue change in solvent accessible surface area as computed by naccess. The residue in the complex is compared to the residue in the bound conformation of a single, uncomplexed chain. That is, this is a measure of how much SASA is "covered" by the partner protein chain(s) in the complex.
- Relative ΔSASA Similar to above, but expressed as a percentage of the total possible SASA.
- Conservation A per-residue conservation score computed using Scorecons. A higher value indicates that a residue is more conserved.
- Evolutionary Rate A per-residue evolutionary rate computed using Rate4Site. A higher value indicates that a a residue is less conserved.
Searching
All of the above properties can be used as search criteria to find clusters of residues. The Add Search Criteria button allows you to conjunctively combine an arbitrary number of filters to create a highly specific custom filter. Filter presets are also available (bottom left) for common categories. Both the lower and upper bounds of value ranges are inclusive (e.g., a cluster size filter between 3 and 4 will return all clusters of size 3 and 4). If a value is left unspecified, then the range is open-ended.

The Load and Save buttons in the Search panel allow the saving and sharing of specific sets of search criteria. An example search for the p53/MDM2 interface can be performed here.
Browsing Results
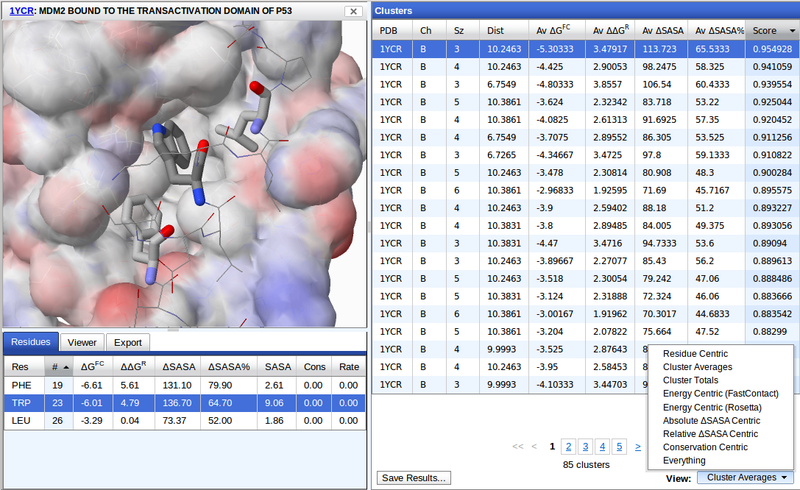
The Clusters panel displays all the matching clusters of the specified search. Because there are a large number of properties associated with each cluster, there are multiple viewing options that display different subsets of properties. For example, Cluster Averages displays the PDB, chain (Ch), number of residues in the cluster (Sz), maximum spanning distance of the cluster (Dist), average energy and SASA properties, and the overall score. The Residue Centric view (see below) provides the PDB, chain, residue type, residue number, and total energy and SASA properties. The clusters may be sorted by any shown property by clicking the corresponding column header. The direction of sort can be changed by clicking the column header a second time.
Selecting a cluster row will create a WebMol viewer of the selected cluster (left panel). If your browser supports WebGL, a WebGL viewer based off of GLmol will be used, otherwise the Jmol viewer will be used and Java will be required. The controls for these viewers are shown below.
| WebGL Viewer | Jmol Viewer | |
|---|---|---|
| Rotate | Left click | Left click |
| Translate | Ctrl-click or middle click | Ctrl-right click or Shift-double click |
| Zoom | Scroll wheel, Shift-click, or right click | Scroll wheel or Shift-click |
Multiple clusters on the same chain may be selected using the Shift or Cntrl keys (see below). Details on the individual residues of the cluster are shown in the Residues tab beneath the molecular viewer. Selecting individual residues in this table will highlight the corresponding residue in the viewer (see above).
Visualization
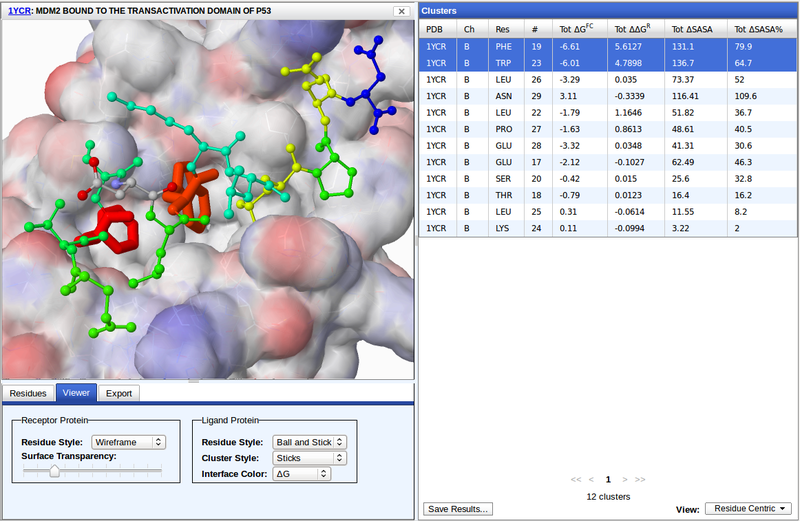
The Viewer tab under the molecular viewer controls the display of the protein-protein interface. The receptor protein consists of all chains of the complex that are not the cluster chain. The transparency of the receptor surface can be scaled from fully opaque to completely absent. The receptor surface is color mapped to the partial charges of the residues. There are several residue styles to choose from to display the receptor and ligand protein residues.
The ligand protein is the full chain of the selected cluster(s), including non-interface residues. Residues belonging to the selected cluster(s) are display in a separate style specified by Cluster Style.
Interface residues may be colored by their property values, such as ΔG. Properties are mapped to a rainbow (ROYGB) spectrum where the smallest values are always red and the largest blue.
Saving Results

The structure of the selected cluster(s) shown in the molecular viewer may be exported for further analysis. The cluster may be saved as a PDB file or the structure can be sent to either the AnchorQuery or ZINCPharmer websites. These pharmacophore search engines will automatically identify a candidate interaction pharmacophore from the exported cluster.